Moving between DGGS
Move data between grid systems when you need to combine datasets or use a different cell shape. regrid handles both a change of system and a change of resolution.
This example moves monthly soil moisture from HEALPix to IGeo7. We compare area averaging and point interpolation, first on a much finer destination and then on grids of similar cell size. The setup repeats the data loading from Regridding, so you can run this page on its own.
ENV["RASTERDATASOURCES_PATH"] = mkpath(get(ENV, "RASTERDATASOURCES_PATH", joinpath(tempdir(), "rasterdatasources")))

import DiscreteGlobalGrids as DGG
import DimensionalData as DD
using Rasters, RasterDataSources
import NCDatasets
import Extents
using Statistics
using GLMakie, GeoMakie
using DiscreteGlobalGridsVisualization: dggpoly, dggpoly!
GLMakie.activate!(inline = true)

soil = Rasters.set(Raster(RasterDataSources.getraster(CPCSoil; period = "1981-2010");
    name = :soilw), Ti => 1:12)
soil = DD.rebuild(soil; metadata = DD.NoMetadata())
┌ 720×360×12 Raster{Union{Missing, Float32}, 3} soilw ┐
├─────────────────────────────────────────────────────┴────────── dims ┐
↓ X Mapped{Float64} 0.25:0.5:359.75 ForwardOrdered Regular Points,
→ Y Mapped{Float64} 89.75:-0.5:-89.75 ReverseOrdered Regular Points,
↗ Ti Sampled{Int64} 1:12 ForwardOrdered Regular Points
├────────────────────────────────────────────────────────────── raster ┤
missingval: missing
extent: Extent(X = (0.25, 359.75), Y = (-89.75, 89.75), Ti = (1, 12))
crs: EPSG:4326
mappedcrs: EPSG:4326
└──────────────────────────────────────────────────────────────────────┘
[:, :, 1]
↓ → 89.75 89.25 88.75 … -89.25 -89.75
0.25 missing missing missing 1.86265f-6 1.86265f-6
0.75 missing missing missing 1.86265f-6 1.86265f-6
1.25 missing missing missing 1.86265f-6 1.86265f-6
⋮ ⋱ ⋮
358.25 missing missing missing 1.86265f-6 1.86265f-6
358.75 missing missing missing 1.86265f-6 1.86265f-6
359.25 missing missing missing 1.86265f-6 1.86265f-6
359.75 missing missing missing … 1.86265f-6 1.86265f-6healpix = DGG.levelgrid(DGG.HEALPixSystem(), 7)
soilonhealpix = DGG.regrid(soil; to = healpix)┌ 196608×12 Raster{Union{Missing, Float32}, 2} soilw ┐
├────────────────────────────────────────────────────┴───────────── dims ┐
↓ Cells CellLookup(HEALPixSystem, level=7, ncells=196608, 1 windows),
→ Ti Sampled{Int64} 1:12 ForwardOrdered Regular Points
├──────────────────────────────────────────────────────────────── raster ┤
missingval: missing
extent: Extent(Cells = (LevelIndex(7, 0), LevelIndex(7, 196607)), Ti = (1, 12))
└────────────────────────────────────────────────────────────────────────┘
↓ → 1 … 10 11 12
LevelIndex(7, 0) missing missing missing missing
LevelIndex(7, 1) missing missing missing missing
LevelIndex(7, 2) missing missing missing missing
LevelIndex(7, 3) missing missing missing missing
⋮ ⋱ ⋮
LevelIndex(7, 196604) missing … missing missing missing
LevelIndex(7, 196605) missing missing missing missing
LevelIndex(7, 196606) missing missing missing missing
LevelIndex(7, 196607) missing missing missing missingMove the cube from HEALPix onto IGeo7
to names the destination grid and from names the source grid:
igeo7 = DGG.levelgrid(DGG.IGeo7System(), 5)
crossed = DGG.regrid(soilonhealpix; to = igeo7, from = healpix)
┌ 168072×12 Raster{Union{Missing, Float32}, 2} soilw ┐
├────────────────────────────────────────────────────┴─────────── dims ┐
↓ Cells CellLookup(IGeo7System, level=5, ncells=168072, 1 windows),
→ Ti Sampled{Int64} 1:12 ForwardOrdered Regular Points
├────────────────────────────────────────────────────────────── raster ┤
missingval: missing
extent: Extent(Cells = (Z7Cell("0000000"), Z7Cell("1166666")), Ti = (1, 12))
└──────────────────────────────────────────────────────────────────────┘
↓ → 1 … 10 11 12
Z7Cell("0000000") 378.107 314.525 341.757 361.381
Z7Cell("0000001") 386.456 324.901 349.228 368.652
Z7Cell("0000003") 405.58 337.89 363.336 384.638
Z7Cell("0000004") missing missing missing missing
⋮ ⋱ ⋮
Z7Cell("1166663") missing missing missing missing
Z7Cell("1166664") missing … missing missing missing
Z7Cell("1166665") missing missing missing missing
Z7Cell("1166666") missing missing missing missingThe result has one value per IGeo7 cell for each of the twelve months. Plot January to see the soil moisture field on the new cells; missing ocean values remain blank.
january = Rasters.replace_missing(crossed[Ti = 1], NaN)

fig = Figure(size = (820, 400))
ax = GeoAxis(fig[1, 1]; dest = "+proj=natearth2", xticks = -120:60:120,
    yticks = -60:30:60, title = "January on IGeo7 level 5")
plt = dggpoly!(ax, january; color = january, colormap = :viridis)
Colorbar(fig[1, 2], plt; label = "soil moisture (mm)")
fig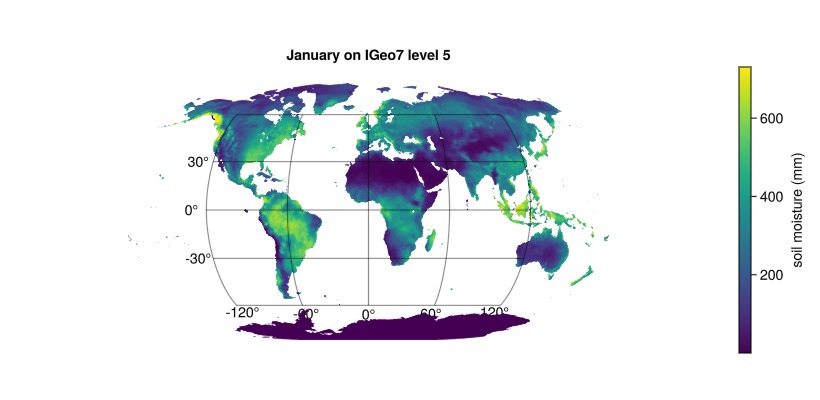
Check the cell size and the land mean
Metres across a cell, on either grid:
DGG.cellsize(healpix), DGG.cellsize(igeo7)(50934.54534963078, 55089.48974970403)These levels have similar cell widths. Comparing their plain means gives a quick check of the effect on the data. For an area-weighted comparison, use cell_area weights on IGeo7 and account for changes in coastal coverage; its cells are only approximately equal in area.
mean(skipmissing(soilonhealpix)), mean(skipmissing(crossed))(234.18f0, 234.24306f0)Refine a coarse field onto a finer grid
A finer destination makes the choice of method visible. Choose according to what a source value represents: an average over a cell, or a measurement at a point.
| method | what a destination cell gets |
|---|---|
Conservative() (default) | the area-weighted mean of the source cells under it |
BarycentricPoint() | a sample at its centre, interpolated from surrounding source centres |
HEALPix level 4 cells are 407 km across, against 55 km on IGeo7 level 5, so roughly fifty destination cells sit under each source cell:
coarse = DGG.levelgrid(DGG.HEALPixSystem(), 4)
oncoarse = DGG.regrid(soil[Ti = 1]; to = coarse)
┌ 3072-element Raster{Union{Missing, Float32}, 1} soilw ┐
├───────────────────────────────────────────────────────┴──────── dims ┐
↓ Cells CellLookup(HEALPixSystem, level=4, ncells=3072, 1 windows)
├────────────────────────────────────────────────────────────── raster ┤
missingval: missing
extent: Extent(Cells = (LevelIndex(4, 0), LevelIndex(4, 3071)),)
└──────────────────────────────────────────────────────────────────────┘
LevelIndex(4, 0) 56.9069
LevelIndex(4, 1) 47.07
LevelIndex(4, 2) 91.2624
LevelIndex(4, 3) 48.9381
LevelIndex(4, 4) missing
⋮
LevelIndex(4, 3067) 535.842
LevelIndex(4, 3068) 375.386
LevelIndex(4, 3069) 234.268
LevelIndex(4, 3070) 415.771
LevelIndex(4, 3071) 326.49Both methods run across that pair:
blocky = DGG.regrid(oncoarse; to = igeo7, from = coarse)
smooth = DGG.regrid(oncoarse; to = igeo7, from = coarse,
    method = DGG.BarycentricPoint())
┌ 168072-element Raster{Union{Missing, Float32}, 1} soilw ┐
├─────────────────────────────────────────────────────────┴────── dims ┐
↓ Cells CellLookup(IGeo7System, level=5, ncells=168072, 1 windows)
├────────────────────────────────────────────────────────────── raster ┤
missingval: missing
extent: Extent(Cells = (Z7Cell("0000000"), Z7Cell("1166666")),)
└──────────────────────────────────────────────────────────────────────┘
Z7Cell("0000000") 395.911
Z7Cell("0000001") 389.974
Z7Cell("0000003") 395.141
Z7Cell("0000004") 399.736
Z7Cell("0000005") 392.797
⋮
Z7Cell("1166662") missing
Z7Cell("1166663") missing
Z7Cell("1166664") missing
Z7Cell("1166665") missing
Z7Cell("1166666") missingIndex by an extent to draw Europe alone:
europe = Extents.Extent(X = (-12.0, 42.0), Y = (35.0, 65.0))
crange = extrema(filter(!isnan, january))

fig = Figure(size = (900, 430))
plots = map(enumerate(("Conservative()" => blocky,
                       "BarycentricPoint()" => smooth))) do (k, (name, field))
    ax = GeoAxis(fig[1, k]; dest = "+proj=laea +lat_0=52 +lon_0=15",
        xticks = -10:10:40, yticks = 35:10:65, title = name)
    sub = Rasters.replace_missing(field, NaN)[DGG.Cells(DGG.Covering(europe))]
    dggpoly!(ax, sub; color = sub, colormap = :viridis, colorrange = crange)
end
Colorbar(fig[1, 3], first(plots); label = "soil moisture (mm)")
fig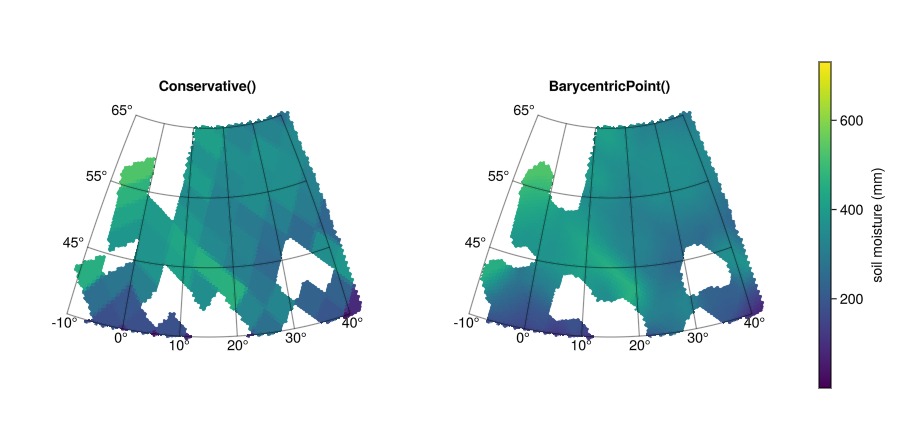
Conservative() repeats a source value in destination cells wholly inside that source cell, and combines values where cells overlap. The coarse HEALPix pattern remains visible. BarycentricPoint() treats the values as samples at the source centres and interpolates a smoother surface. Neither method adds measurements at the finer resolution.
Compare the two methods at equal resolution
HEALPix level 7 and IGeo7 level 5 hold cells of nearly the same size, so each destination cell draws on one source cell and its immediate neighbours. Run BarycentricPoint() across that pair:
pointwise = Rasters.replace_missing(
    DGG.regrid(soilonhealpix[Ti = 1]; to = igeo7, from = healpix,
        method = DGG.BarycentricPoint()), NaN)
┌ 168072-element Raster{Float64, 1} soilw ┐
├─────────────────────────────────────────┴────────────────────── dims ┐
↓ Cells CellLookup(IGeo7System, level=5, ncells=168072, 1 windows)
├────────────────────────────────────────────────────────────── raster ┤
missingval: NaN
extent: Extent(Cells = (Z7Cell("0000000"), Z7Cell("1166666")),)
└──────────────────────────────────────────────────────────────────────┘
Z7Cell("0000000") 383.428
Z7Cell("0000001") 388.888
Z7Cell("0000003") 405.089
Z7Cell("0000004") NaN
Z7Cell("0000005") 386.533
⋮
Z7Cell("1166662") NaN
Z7Cell("1166663") NaN
Z7Cell("1166664") NaN
Z7Cell("1166665") NaN
Z7Cell("1166666") NaNThe 99th percentile of the absolute difference, beside the standard deviation of the field itself, in millimetres:
q99 = quantile(abs.(filter(!isnan, january .- pointwise)), 0.99)
(q99 = q99, sigma = std(filter(!isnan, january)))
(q99 = 7.097989501953106, sigma = 177.12822435030637)Compare q99 with sigma to judge the method difference relative to the field's own variation. The third panel shows where the methods differ:
conservative = january[DGG.Cells(DGG.Covering(europe))]
barycentric = pointwise[DGG.Cells(DGG.Covering(europe))]

fig = Figure(size = (1240, 430))
plots = map(enumerate(("Conservative()" => conservative,
                       "BarycentricPoint()" => barycentric))) do (k, (name, field))
    ax = GeoAxis(fig[1, k]; dest = "+proj=laea +lat_0=52 +lon_0=15",
        xticks = -10:10:40, yticks = 35:10:65, title = name)
    dggpoly!(ax, field; color = field, colormap = :viridis, colorrange = crange)
end
Colorbar(fig[1, 3], first(plots); label = "soil moisture (mm)")
ax = GeoAxis(fig[1, 4]; dest = "+proj=laea +lat_0=52 +lon_0=15",
    xticks = -10:10:40, yticks = 35:10:65, title = "difference")
plt = dggpoly!(ax, conservative; color = conservative .- barycentric,
    colormap = :balance, colorrange = (-q99, q99))
Colorbar(fig[1, 5], plt; label = "Conservative() − BarycentricPoint() (mm)")
fig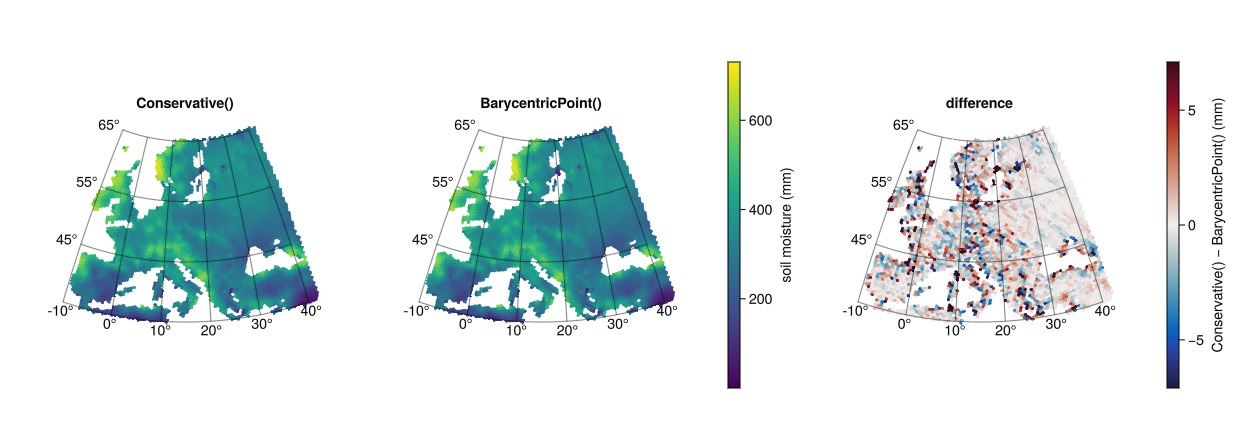
Coastal cells are particularly sensitive to the method: area averaging uses overlap weights, while point interpolation uses surrounding sample sites. Missing source values can therefore affect different destination cells. Compare how many cells each method leaves missing:
count(isnan, pointwise) - count(isnan, january)5Reuse one plan across the twelve months
plan_regrid builds the weights for the pair of grids once. Every field that crosses the same pair — the twelve months here — reuses them:
plan = DGG.plan_regrid(soilonhealpix; to = igeo7, from = healpix)DirectPlan(Conservative, 168072 ← 196608 cells)Reuse the output buffer while computing a monthly mean. Each call replaces the previous month's values:
dest = DGG.regrid(soilonhealpix[Ti = 1], plan)
seasonal = map(1:12) do m
    DGG.regrid!(dest, soilonhealpix[Ti = m], plan)
    mean(skipmissing(dest))
end
12-element Vector{Float32}:
240.7321
241.66368
240.87865
238.77173
234.95622
230.96852
229.11075
229.09587
228.43094
228.95135
231.41814
235.95168Plot the monthly cell means to see the seasonal cycle:
fig = Figure(size = (600, 340))
ax = Axis(fig[1, 1]; xticks = 1:12, xlabel = "month",
    ylabel = "mean soil moisture (mm)", title = "global land mean, IGeo7 level 5")
scatterlines!(ax, 1:12, seasonal)
fig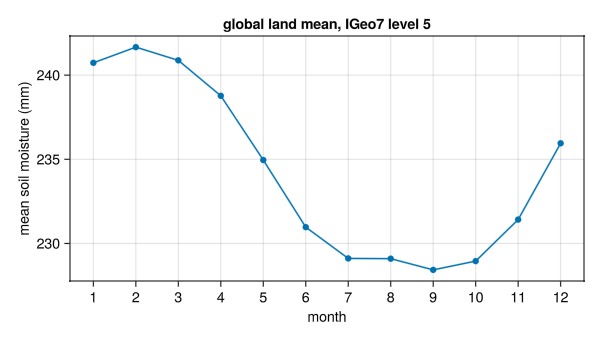
Let the destination match the source resolution
Pass a system as to to choose the destination level automatically. Here it selects the IGeo7 level closest in cell size to HEALPix level 7:
DGG.regrid(soilonhealpix[Ti = 1]; to = DGG.IGeo7System(), from = healpix)┌ 168072-element Raster{Union{Missing, Float32}, 1} soilw ┐
├─────────────────────────────────────────────────────────┴────── dims ┐
↓ Cells CellLookup(IGeo7System, level=5, ncells=168072, 1 windows)
├────────────────────────────────────────────────────────────── raster ┤
missingval: missing
extent: Extent(Cells = (Z7Cell("0000000"), Z7Cell("1166666")),)
└──────────────────────────────────────────────────────────────────────┘
Z7Cell("0000000") 378.107
Z7Cell("0000001") 386.456
Z7Cell("0000003") 405.58
Z7Cell("0000004") missing
Z7Cell("0000005") 390.218
⋮
Z7Cell("1166662") missing
Z7Cell("1166663") missing
Z7Cell("1166664") missing
Z7Cell("1166665") missing
Z7Cell("1166666") missingFor a regional destination, pass a cell collection or coverage as to; Multi-order coverage shows that workflow. Choosing a regridding method provides the method and missing-data reference.
This page was generated using Literate.jl.